
61. निम्नलिखित में से बताइए कि कौन सा विकल्प निवेश का उदाहरण नहीं है ?
(A) म्युचूअल फंड और एस.आई.पी.
(B) कमोडिटीज और शेयर की खरीद-बेच
(C) ज़मीन या सोना खरीदना
(D) सेविंग बैंक खाते में रखा धन
Show Answer
Hide Answer
62. अनुच्छेद के आधार पर बताइए कि निम्नलिखित में निवेश की कौन सी सही विशेषताएँ हैं ?
(i) निवेश से दीर्घकालिक आर्थिक लक्ष्य प्राप्त किए जा सकते हैं।
(ii) निवेश अल्पावधि में धनार्जन का तरीका होता है।
(iii) गृहिणियों द्वारा परिवार के खर्चों से पक्ष गई राशि अच्छा निवेश है।
(iv) निवेश में ऊँचे रिटर्न की सम्भावना के साथ रिस्क भी रहता है।
(A) (i) और (iv)
(B) (i) और (iii)
(C) (ii) और (iii)
(D) (ii) और (iv)
Show Answer
Hide Answer
63. निम्नलिखित में से बताइए कि कौन सा विकल्प निवेश का उदाहरण है ?
(A) पोस्ट ऑफिस में पाँच वर्ष की अवधि तक के लिए रखा गया धन ।
(B) बच्चों के पिग्गी बॉक्स में रखा पैसा ।
(C) सेविंग बैंक खाते में रखा धन ।
(D) सोने के गहने खरीदना ।
Show Answer
Hide Answer
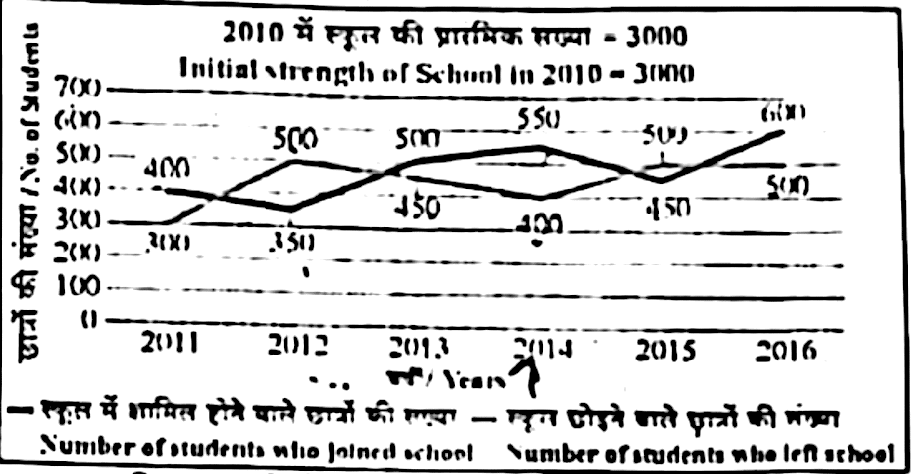
प्रश्न सं. 64 से 68 : निम्नलिखित लाइन ग्राफ (रेखा आलेख) का अध्ययन करें जो 2011 से 2016 तक छह वर्षों के दौरान प्रत्येक वर्ष की शुरुआत में स्कूल में शामिल होने और स्कूल छोड़ने वाले छात्रों की संख्या देता है।
Q.Nos. 64 to 68 : Study the following line graph which gives the number of students who joined the school and left the school in the beginning of each year during six years, from 2011 to 2016.
64. किस वर्ष में, पिछले वर्ष की तुलना में स्कूल छोड़ने वाले छात्रों की संख्या में प्रतिशत वृद्धि/गिरावट अधिकतम है ?
In which year, the percentage rise/fall in the number of students who left the school compared to the previous year is maximum ?
(A) 2011
(B) 2013
(C) 2012
(D) 2014
Show Answer
Hide Answer
65. 2012 से 2013 तक स्कूल की संख्या में लगभग कितने प्रतिशत की वृद्धि/कमी हुई ?
The strength of school increased / decreased from 2012 10 2013 by approximately what percent ?
(A) 1.1%
(B) 2.1%
(C) 1.7%
(D) 2.3%
Show Answer
Hide Answer
66. 2014 के दौरान स्कूल में पढ़ने वाले छात्रों की संख्या थी:
The number of students studying in the school during 2014 was :
(A) 2750
(B) 3050
(C) 2850
(D) 3150
Show Answer
Hide Answer
67. दी गई अवधि के दौरान किसी भी वर्ष में स्कूल में शामिल होने वाले छात्रों की न्यूनतम संख्या का स्कूल छोड़ने वाले छात्रों की अधिकतम संख्या से अनुपात कितना है ?
The ratio of the least number of students who joined the school to the maximum number of students who left school in any of the years during the given period is :
(B) 5:8
(C) 7:9
(D) 5:7
Show Answer
Hide Answer
68. 2013 में स्कूल में पढ़ने वाले छात्रों की संख्या, 2016 में स्कूल में पढ़ने वाले छात्रों की संख्या का कितने प्रतिशत थी ?
The number of students studying in the school in 2013 was what percent of the number of students studying in the school in 2016?
(A) 87%
(B) 90.50%
(C) 89.12%
(D) 93.75%
Show Answer
Hide Answer
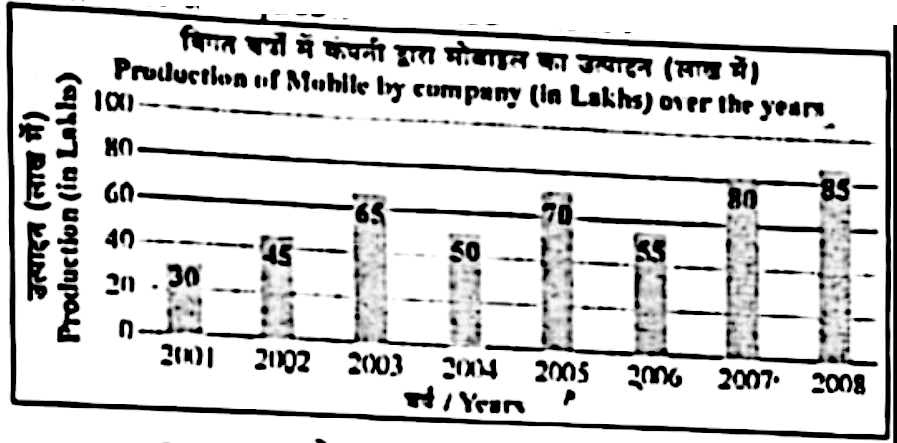
प्रश्न सं. 69 से 73 :दंड आलेख का अध्ययन करें और उस पर आधारित प्रश्नों के उत्तर दें।
Q. Nos. 69 to 73 : Study the bar graph and answer the questions based on it :
69. 2005 और 2006 का औसत उत्पादन निम्नलिखित में से किस वर्ष के युग्म के औसत उत्पादन के ठीक बराबर था ?
(A) 2006 और 2007
(B) 2004 और 2006
(C) 2004 और 2005
(D) 2002 और 2007
The average production of 2005 and 2006 was exactly equal to the average production of which of the following pairs of years?
(A) 2006 and 2007
(B) 2004 and 2006
(C) 2004 and 2005
(D) 2002 and 2007
Show Answer
Hide Answer
70. 2003 से 2004 तक मोबाइल के उत्पादन में लगभग प्रतिशत गिरावट कितनी थी ?
What was the approximate percentage decline in the production of mobile In 2003102004?
(A) 21%
(B) 27%
(C) 23%
(D) 29%
Show Answer
Hide Answer
71. पिछले वर्ष की तुलना में किस वर्ष उत्पादन में प्रतिशत वृद्धि सबसे अधिक थी ?
In which year the percentage increase in production as compared to the previous year was the maximum ?
(A) 2002
(B) 2005
(C) 2003
(D) 2007
Show Answer
Hide Answer
72. दिए गए कितने वर्षों में मोबाइल का उत्पादन दिए गए वर्षों के औसत उत्पादन से अधिक था ?
In how many of the given years was the production mobiles more than the average production of the given years?
(A) 1
(B) 3
(C) 2
(D) 4
Show Answer
Hide Answer
73. 2001 की तुलना में 2008 में मोबाइल के उत्पादन में अनुमानित प्रतिशत वृद्धि कितनी थी ?
(A) 166.67%
(B) 195%
(C) 183.33%
(D) 200%
Show Answer
Hide Answer
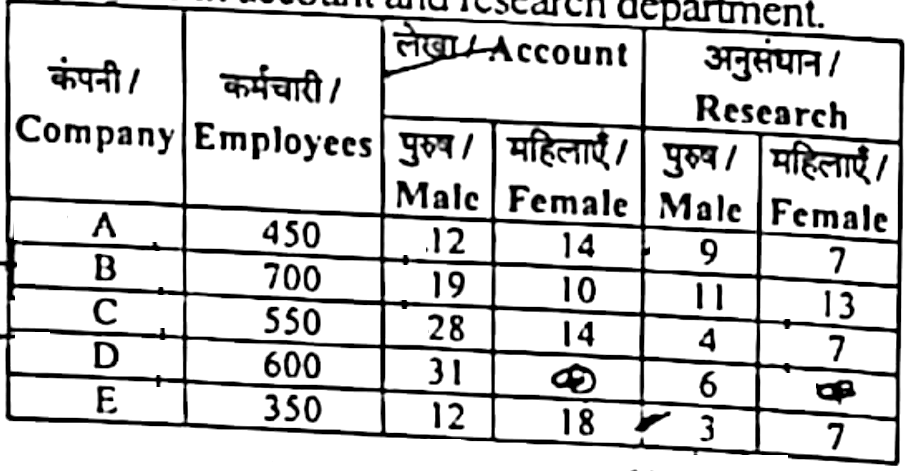
प्रश्न सं. 74 से 78 : हमें विभिन्न पाँच कंपनियाँ और इन कंपनियों में काम करने वाले कर्मचारियों की संख्या दी गई है। तालिका में हमें लेखा एवं अनुसंधान विभाग में कार्यरत पुरुष एवं महिला कर्मचारियों का प्रतिशत भी दिया गया है। Q. Nos. 74 to 78 : There are five companies and we have been given the number of employees working in different companies. In the table we have also been given the percentage of male and female employees in account and research department.
74. यदि लेखा विभाग में कंपनी के 60% कर्मचारियों के पास MBA की डिग्री है और अनुसंधान विभाग में उसी कंपनी के 40% कर्मचारियों के पास MBA की डिग्री है, तो कंपनी E में कितने कर्मचारियों के पास MBA की डिग्री है ?
If 60% of the employees of company E in account department have MBA degree and 40% of the employees of the same company in the research department have MBA degree, then how many employees have MBA degree in company E?
(A) 92
(B) 77
(C) 106
(D) 66
Show Answer
Hide Answer
75. कंपनी A के लेखा कर्मचारियों की कुल संख्या कंपनी E के अनुसंधान कर्मचारियों की कुल संख्या से लगभग कितने प्रतिशत अधिक है ?
The total number of account employees of company A is approximately what percent more than the total number of research employees of company E?
(A) 231.21%
(B) 234.29%
(C) 238.54%
(D) 228.67%
Show Answer
Hide Answer
76. कंपनी A और C दोनों के लेखा विभाग में कार्यरत कुल पुरुष कर्मचारियों का कंपनी B और D दोनों के अनुसंधान विभाग में कार्यरत कुल महिला कर्मचारियों से अनुपात कितना है ?
What is the ratio of the male employees in account department of company A and C together to the female employees of research department in company B and D together?
(A) 208 : 115
(B) 27 : 187
(C) 43 : 188
(D) इनमें से कोई नहीं/ None of these
Show Answer
Hide Answer
77. सभी कंपनियों (कंपनी D को छोड़कर) में लेखा विभाग की महिला कर्मचारियों की कुल मिलाकर संख्या और सभी कंपनियों (कंपनी A और E को छोड़कर) · में अनुसंधान विभाग के पुरुष कर्मचारियों की कुल मिलाकर संख्या के बीच का अंतर कितना है ?
What is the difference between the number of female employees of account department in all companies together (excluding company D) and the male employees of research department in all companies together (excluding company A and E)?
(A) 128
(B) 142
(C) 138
(D) इनमें से कोई नह। None of these
Show Answer
Hide Answer
78. लेखा विभाग में कंपनी B की महिला कर्मचारियों की संख्या का अनुसंधान विभाग में कंपनी C के पुरुष कर्मचारियों की संख्या से अनुपात कितना है ?
What is the ratio of the number of female employees of company B in account department to the number of male employees of company C in rescarch department ?
(A) 5 : 2
(B) 13 : 4
(C) 35 : 11
(D) 4 : 13
Show Answer
Hide Answer
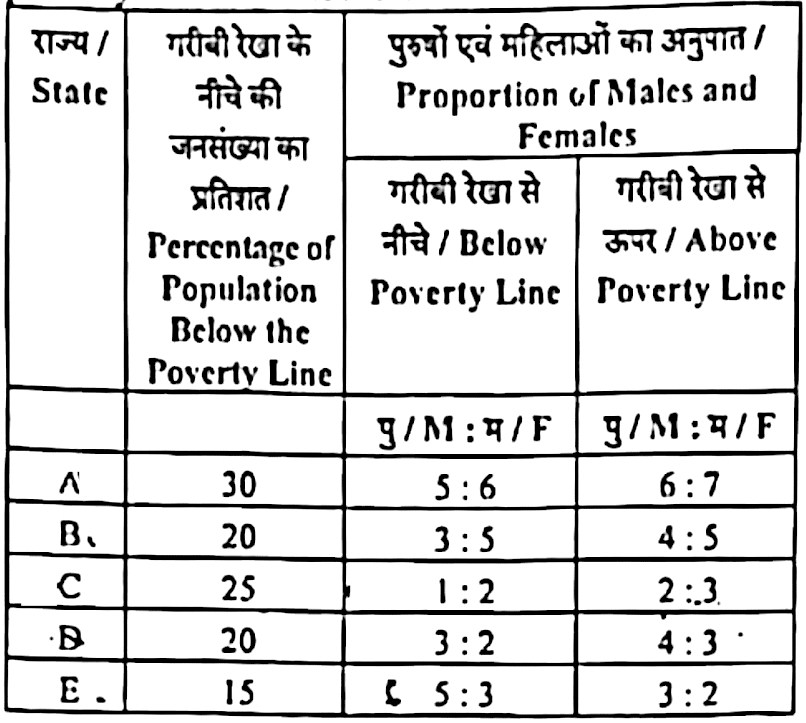
प्रश्न सं. 79 से 83 : निम्न तालिका गरीबी रेखा और लिंग के आधार पर पांच राज्यों A, B, C, D और E की जनसंख्या का प्रतिशत वितरण देती है।
Q. Nos. 79 to 83 : The following table gives the percentage distribution of population of five states A, B, C, D and E on the basis of poverty line and also on the basis of sex.
79. राज्य D में गरीबी रेखा से ऊपर आने वाली महिलाओं की संख्या क्या होगी, यदि यह ज्ञात हो कि राज्य की जनसंख्या 7 मिलियन है ?
(A) 2.4 मिलियन
(B) 3 मिलियन
(C) 1.3 मिलियन
(D) 3.6 मिलियन
What will be the number of females above the poverty line in the state D, if it is known that the population of state D is 7 million ?
(A) 2.4 million
(B) 3 million
(C) 1.3 million
(D) 3.6 million
Show Answer
Hide Answer
80. यदि राज्य C के लिए गरीबी रेखा से ऊपर आने वाले पुरुषों की जनसंख्या 1.5 मिलियन है, तो राज्य C की कुल जनसंख्या कितनी है ?
(A) 4.5 मिलियन
(B) 5.25 मिलियन
(C) 5 मिलियन
(D) 5.75 मिलियन
If the male population above poverty line for state C is 1.5 million, then the ‘total population of state C is:
(A) 4.5 million
(B) 5.25 millions
(C) 5 million
(D) 5.75 million
Show Answer
Hide Answer
