निर्देश (81-85) : प्रश्न दिए गए ग्राफ पर आधारित हैं । इन प्रश्नों के उत्तर दें।
Directions (81-85) : The questions are based on the below shown graph. Answer these questions. ग्राफ में एक परीक्षा में 7 छात्रों के इतिहास और भूगोल के अंकों का अनुपात दर्शाया गया है । The graph shows the ratio of marks of History to Geography of 7 students in an examination.
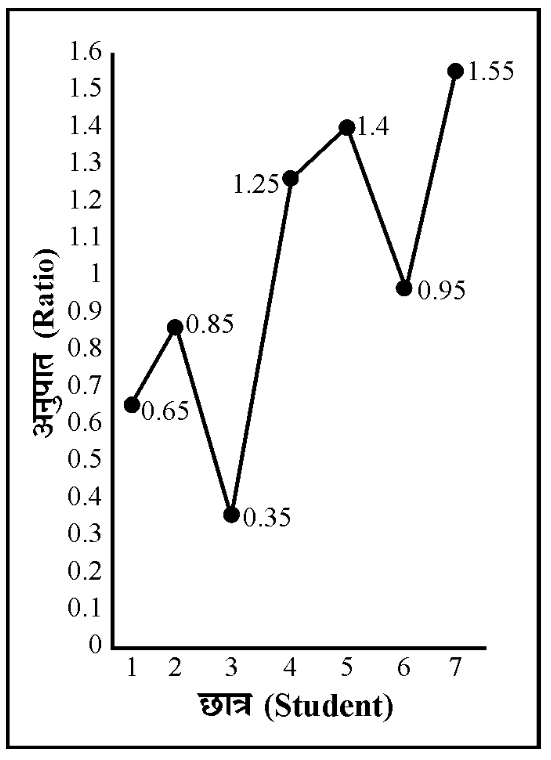
81. कितने छात्रों ने भूगोल की अपेक्षा इतिहास में ज्यादा अंक अर्जित किए ?
How many students got more marks in History than in Geography ?
(A) 2
(B) 3
(C) 4
(D) 5
Show Answer
Hide Answer
82. निम्न में से किन छात्रों को भूगोल की अपेक्षा इतिहास में कम अंक मिले ?
Which of the following students got less marks in History than in Geography ?
(A) 1, 3, 5, 6
(B) 1, 2, 3, 6
(C) 1, 4, 5, 7
(D) 4, 5, 7 |
Show Answer
Hide Answer
83. भूगोल में छात्र 3 से 4 के मध्य अंक की प्रतिशत बढ़त है –
Percentage increase of marks in Geography from student 3 to 4 is –
(A) 15
(B) 20
(C) 90
(D) आँकड़े अपर्याप्त/Insufficient data
Show Answer
Hide Answer
84. इतिहास/भूगोल के अधिकतम अनुपात और न्यूनतम अनुपात का अंतर है
The difference of the maximum ratio and minimum ratio of History/Geography is
(A) 0.45
(B) 0.50
(C) 0.90
(D) 1.20
Show Answer
Hide Answer
85. छात्र 4 को भूगोल में 60 अंक मिले। उसके इतिहास में अंक हैं –
Student 4 got 60 marks in Geography. His marks in History are –
(A) 48
(B) 68
(C) 75
(D) इनमें से कोई नहीं/ None of these
Show Answer
Hide Answer
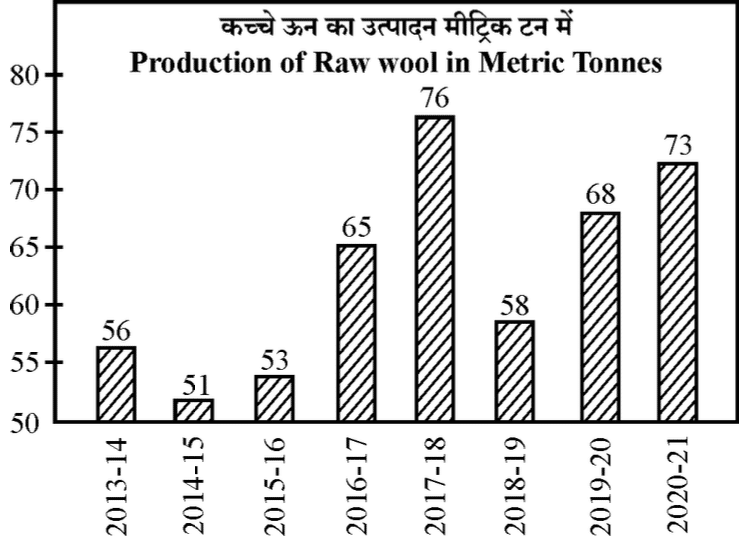
निर्देश (86-90) : ग्राफ का अध्ययन कर निम्नलिखित प्रश्नों के उत्तर देवें :
Directions (86-90) : Study the graph and answer the following questions :
86. कच्चे ऊन के उत्पादन में उच्चतम वृद्धि का वर्ष था :
The maximum rise in the production of raw wool was in the year :
(A) 2017-18
(B) 2020-21
(C) 2016-17
(D) 2019-20
Show Answer
Hide Answer
87. पहले चार वर्षों के उत्पादन की तुलना में अन्तिम चार वर्षों में कच्चे ऊन का उत्पादन _____% बढ़ गया।
During the last four years the production of raw wool increased by ____% on the production of the first four years.
(B) 22.2
(C) 19.8
(D) 25.0
Show Answer
Hide Answer
88. आठ वर्षों के दौरान औसत उत्पादन था
The average production during the eight years was
(A) 67.2 MT
(B) 62.5 MT
(C) 50.0 MT
(D) 52.8 MT
Show Answer
Hide Answer
89. उत्पादन में पिछले वर्ष की तुलना में अधिकतम प्रतिशत घटत किस वर्ष रही ?
The maximum percentage decrease of production over the previous year was in the year :
(A) 2018-19
(B) 2017-18
(C) 2013-14
(D) 2014-15
Show Answer
Hide Answer
90. 2014-15 में कच्चे ऊन का उत्पादन 2019-20 के उत्पादन का ___था।
The production of raw wool in 2014-15 was ____ of the production in 2019-20.
(A) ⅓
(B) ⅔
(C) ½
(D) ¾
Show Answer
Hide Answer
निर्देश (91-95) : दी गई तालिका के आधार पर निम्नलिखित प्रश्नों के उत्तर दीजिए :
Directions (91-95) : Read the following table and answer the questions given below it.
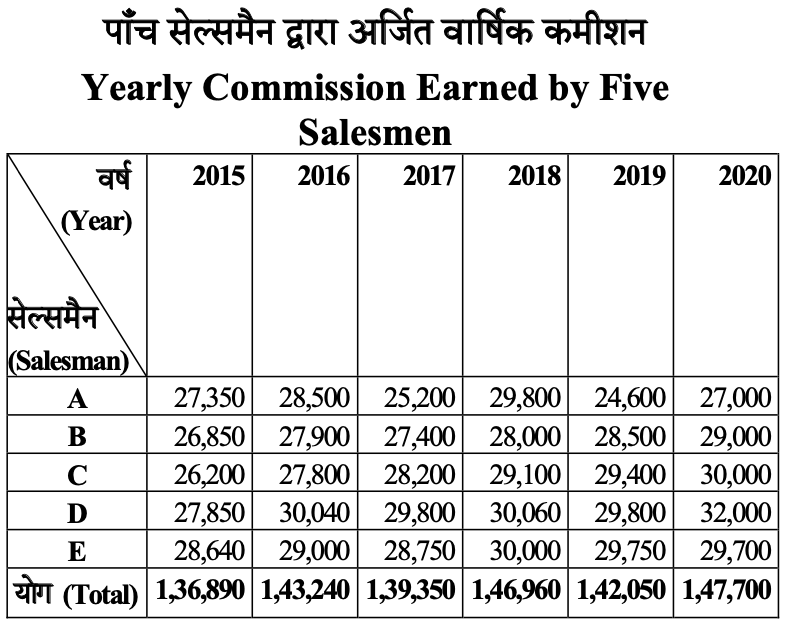
91. किस वर्ष में सेल्समैन C द्वारा अर्जित कमीशन पिछले वर्ष की तुलना में अधिकतम वृद्धि दर्शाता है ?
In which year commission earned by the salesman C showed the highest increase that of the preceding year?
(A) 2016
(B) 2017
(C) 2018
(D) 2019
Show Answer
Hide Answer
92. वर्ष 2018 में B का कमीशन पाँचों सेल्समैनों के उसी वर्ष के कुल कमीशन का लगभग कितना प्रतिशत था ?
In the year 2018 the commission of B was approximately what percent of the total commission earned by all salesmen in that year?
(A) 19.05
(B) 98
(C) 80
(D) इनमें से कोई नहीं/None of these
Show Answer
Hide Answer
93. किस सेल्समैन का 2018 में कमीशन, 2015 की तुलना में उच्चतम वृद्धि दर्शाता है ?
Which salesman’s commission in 2018 show the highest increase over that in 2015 ?
(A) A
(B) B
(C) D
(D) C
Show Answer
Hide Answer
94. निम्न में से किस वर्ष में किसी भी सेल्समैन द्वारा अर्जित उच्चतम और न्यूनतम कमीशन का अंतर अधिकतम है ?
In which of the following year was the difference between the highest and lowest commission earned by any salesman maximum ?
(A) 2017
(B) 2018
(C) 2019
(D) 2020
Show Answer
Hide Answer
95. वर्ष 2019 में सेल्समैन D द्वारा अर्जित कमीशन A द्वारा अर्जित कमीशन का लगभग कितना प्रतिशत है ?
In the year 2019, commission earned by salesman D was approximately what percent of commission earned by A?
(A) 18
(B) 21
(C) 52
(D) इनमें से कोई नहीं/None of these
Show Answer
Hide Answer
निर्देश (96-100) : दी गई तालिका/सारणी का ध्यानपूर्वक अध्ययन करें तथा नीचे दिए प्रश्नों के उत्तर दें :
Directions (96-100) : Study the table and answer the questions given below :
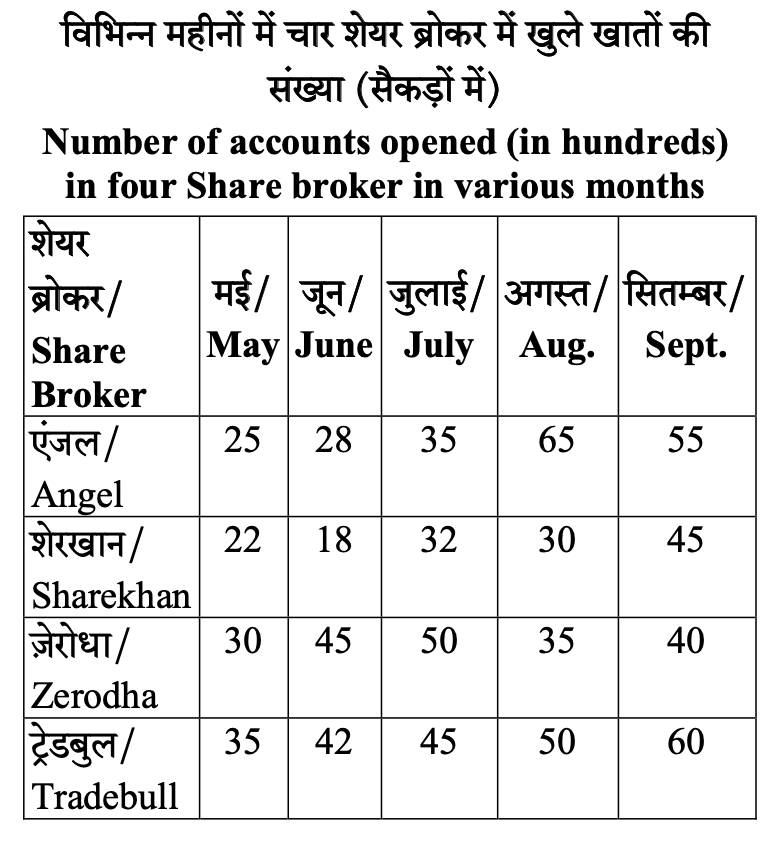
96. निम्नलिखित में से किस महीने में खुले खातों की संख्या की औसत महत्तम है ?
(A) जून
(B) सितम्बर
(C) अगस्त
(D) मई
In which of the following months is the average of the number of opened accounts the maximum ?
(A) June
(B) September
(C) August
(D) May
Show Answer
Hide Answer
97. अगस्त में खुले खातों की संख्या जून में खुले खातों की संख्या से लगभग कितने प्रतिशत कम या ज्यादा थी ?
The number of accounts opened in Aug. is approximately what percent more or less than the number of accounts opened in June ?
(A) 33.5
(B) 35.3
(C) 34.6
(D) 40
Show Answer
Hide Answer
98. मई से सितम्बर तक एंजल में खुले खातों की संख्या से ज़ेरोधा में खुले खातों की संख्या का अनुपात क्या है ?
What is the ratio of the number of accounts opened in Angel to that opened in Zerodha from May to September ?
(A) 1.5
(B) 0.75
(C) 2.25
(D) 1.04
Show Answer
Hide Answer
99. किस शेयर ब्रोकर में खुले खातों की औसत संख्या महत्तम है ?
(A) एंजल
(B) शेरखान
(C) ट्रेडबुल
(D) ज़ेरोधा
In which Share broker is the average number of accounts opened the maximum ?
(A) Angel
(B) Sharekhan
(C) Tradebull
(D) Zerodha
Show Answer
Hide Answer
100. ट्रेडबुल में खुले खातों की संख्या का औसत शेरखान में खुले खातों की संख्या के औसत का लगभग कितना प्रतिशत कम या ज्यादा था ?
The average number of accounts opened in Tradebull is approximate what percent more or less than the average number of accounts opened in Sharekhan ?
(A) 57.82
(B) 60
(C) 45.90
(D) 50.69
Show Answer
Hide Answer
