निर्देश (81-85) : निम्नांकित रेखाचित्र में सीमेंट का विभिन्न वर्षों के दौरान उत्पादन (मिलियन टन में) दर्शाया गया है । इसका अध्ययन करें और निम्नलिखित प्रश्नों के उत्तर दीजिए :
Directions (81-85) : The following graph shows the production of cement in Million Tonnes during the various years. Study the same and answer the following questions correctly :
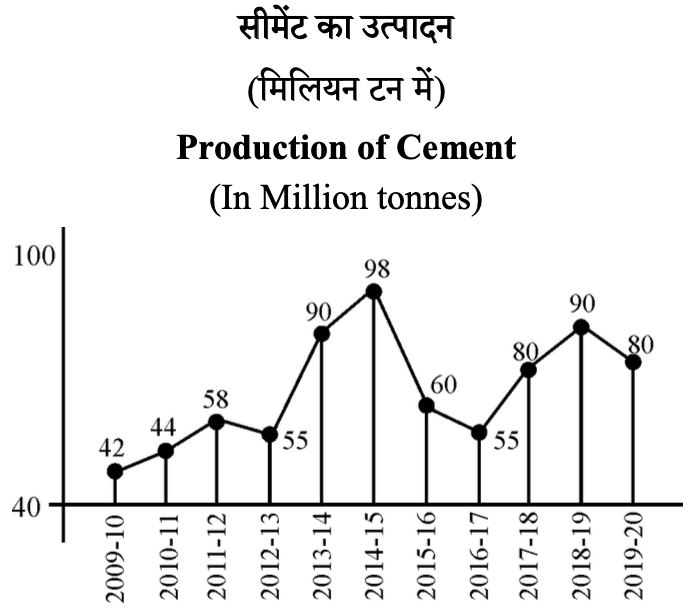
81. उत्पादन अधिकतम स्तर तक इस वर्ष घटा :
The production fell down to the maximum extent in the year :
(A) 2012-13
(B) 2015-16
(C) 2016-17
(D) 2019-20
Show Answer
Hide Answer
82. उत्पादन में पिछले वर्ष की तुलना में वर्ष ____ के दौरान अधिकतम वृद्धि हुई।
The increase in production was maximum during the year ____ over its previous year.
(A) 2013-14
(B) 2017-18
(C) 2014-15
(D) 2018-19
Show Answer
Hide Answer
83. प्रथम तीन वर्ष दौरान औसत उत्पादन था
The average production during the first three years was :
(A) 44 MT
(B) 46 MT
(C) 48 MT
(D) 50 MT
Show Answer
Hide Answer
84. सीमेंट का अधिकतम उत्पादन दर्ज हुआ इस वर्ष :
The maximum production of cement was noted in the year :
(A) 2013-14
(B) 2014-15
(C) 2018-19
(D) 2017-18
Show Answer
Hide Answer
85. वर्ष 2011-12 के दौरान उत्पादन वृद्धि प्रतिशत पिछले वर्ष की तुलना में था
The percentage increase in production during 2011-12 over its previous year was :
(A) 31.8%
(B) 36%
(C) 37.5%
(D) इनमें से कोई नहीं / None of these
Show Answer
Hide Answer
निर्देश (86-90) : दिया गया ग्राफ एक वस्तु X के आयात को 2013 से 2019 के मध्य करोड़ रुपये में दर्शाता है । दर्शाए गए चित्र पर आधारित प्रश्नों के उत्तर दें।
Directions (86-90) : The following graph shows the import of a certain commodity X in Crore Rupees between 2013 and 2019. The questions are based on the shown figure. Answer these questions.
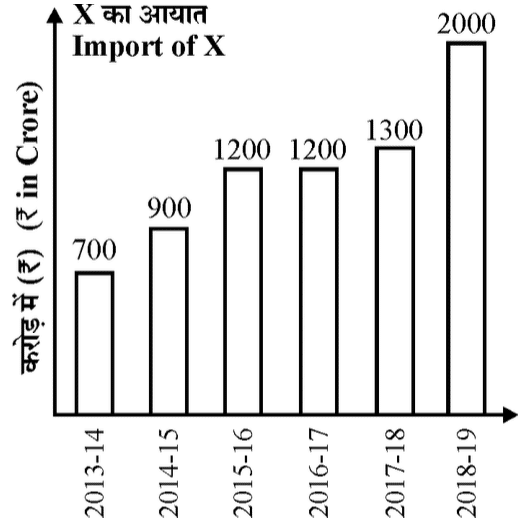
86. वर्ष 2014-15 से 2015-16 के दौरान X के आयात में वृद्धि प्रतिशत है –
Percent increase in import of X from 2014-15 to 2015-16 is
(A) 43.0%
(B) 33.3%
(C) 28.8%
(D) 25.0%
Show Answer
Hide Answer
87. सभी वर्षों के लिए वर्ष दर वर्ष X के आयात की वृद्धि का औसत (₹ करोड़ में) है
Average of the increase in import of X year by year for all the years is (in ₹ crore)
(A) 260
(B) 280
(C) 325
(D) इनमें से कोई नहीं / None of these
Show Answer
Hide Answer
88. विगत कितने वर्षों तक X का आयात, X के औसत आयात से अधिक था ?
For how many years, there was more import of X, than the average import of X?
(A) 4
(B) 3
(C) 2
(D) 1
Show Answer
Hide Answer
89. X के औसत आयात से अधिक आयात और X के औसत आयात से कम आयात के वर्षों का अंतर है
The difference of the numbers of years in which import of X is less than the average import and in which import of X is more than the average import is
(A) 3
(B) 2
(C) 1
(D) 0
Show Answer
Hide Answer
90. वर्ष 2018-19 के दौरान X के आयात में प्रतिशत वृद्धि सभी वर्षों के X के आयात के उसके औसत से कितनी है ?
The percentage increase in import of X during 2018-19 over its Average of Import of X of all years?
(A) 50.9%
(B) 63.5%
(C) 70.6%
(D) 64.38%
Show Answer
Hide Answer
निर्देश (91-95) : दी गई तालिका/सारणी का ध्यानपूर्वक अध्ययन करें तथा नीचे दिए प्रश्नों के उत्तर दें :
Directions (91-95) : Study the table and answer the given questions. निम्न तालिका में चार व्यक्ति A, B, C तथा D सप्ताह के विभिन्न दिनों पर वस्तुओं की बिक्री कर रहे हैं :
In the following table four persons A, B, C and D are selling items on different days of the week.
91. मंगलवार को A द्वारा बेची गई वस्तु तथा शनिवार को C द्वारा बेची गई वस्तु का अनुपात क्या था ? What was the ratio of item sold by A on Tuesday & items sold by C on Saturday ?
(A) 9:7
(B) 7:9
(C) 6:5
(D) 8:7
Show Answer
Hide Answer
92. सोमवार को D द्वारा बेची गई वस्तु, शनिवार को C द्वारा बेची गई वस्तु का कितना प्रतिशत थी ?
Items sold by D on Monday is what percent of item sold by C on Saturday ?
(A) 42.60%
(B) 49.55 %
(C) 44.44%
(D) 32.70%
Show Answer
Hide Answer
93. B, C तथा D द्वारा क्रमशः सोमवार, मंगलवार तथा शनिवार को बेची गई वस्तुओं का औसत क्या है ?
What is the average of the items sold by B, C and D on Monday, Tuesday and Saturday respectively?
(A) 44.33
(B) 42.50
(C) 46.66
(D) 45.90
Show Answer
Hide Answer
94. सप्ताह के सभी चार दिनों में D वस्तु की बिक्री की तुलना में B वस्तु की बिक्री में कितने प्रतिशत की वृद्धि आई ? Percent increase for selling of items B compare with Selling of items D in all four days of weeks is
(A) 29.1%
(B) 19.5%
(C) 18.3%
(D) 28.3 %
Show Answer
Hide Answer
95. सोमवार को बेची गई वस्तुओं की औसत और शुक्रवार को बेची गई वस्तुओं की औसत के मध्य कितना अंतर है ? What is the difference between the average of items selling on Monday to average items selling on Friday ?
(A) 10.5
(B) 7.40
(C) 5.25
(D) 6.45
Show Answer
Hide Answer
निर्देश (96-100) : दी गई तालिका/सारणी का ध्यानपूर्वक अध्ययन करें तथा नीचे दिए प्रश्नों के उत्तर दें:
Directions (96-100) : Study the table and answer the given questions.
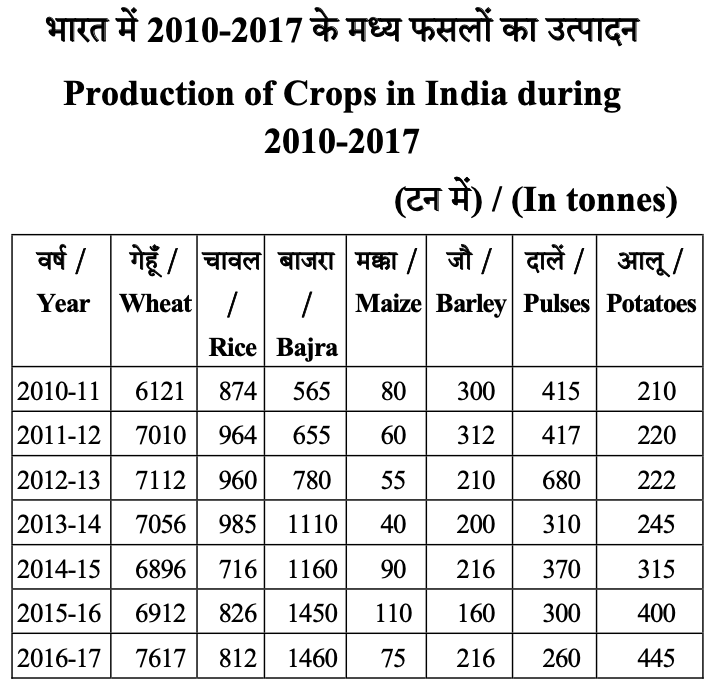
96. गेहूँ उत्पादन में किस वर्ष के दौरान गिरावट दिखाई दी ?
Wheat production started showing a slump during :
(A) 2013-14
(B) 2015-16
(C) 2014-15
(D) 2016-17
Show Answer
Hide Answer
97. इनमें से किस फसल में 2013-2017 के मध्य उत्पादन में लगातार वृद्धि दर्ज की गई ?
(A) मक्का
(B) जौ
(C) दालें
(D) बाजरा
Which of the following crops showed the continuous increase in production during 2013-2017 ?
(A) Maize
(B) Barley
(C) Pulses
(D) Bajra
Show Answer
Hide Answer
98. 2010-11 से 2016-17 की अवधि के मध्य आलू का औसत उत्पादन कितना है ?
(A) 300.00 टन
(B) 293.86 टन
(C) 353.96 टन
(D) 253.86 टन
What is the average yield of potatoes during the period 2010-11 to 2016-17 ?
(A) 300.00 tonnes
(B) 293.86 tonnes
(C) 353.96 tonnes
(D) 253.86 tonnes
Show Answer
Hide Answer
99. 2016-17 के मध्य इनमें से किस फसल के उत्पादन में पिछले वर्ष की तुलना में गिरावट दर्ज की गई ?
(A) जौ
(B) बाजरा
(C) चावल
(D) आलू
During 2016-17, which of the following crops showed decrease in production in comparison to the previous year?
(A) Barley
(B) Bajra
(C) Rice
(D) Potatoes
Show Answer
Hide Answer
100. आलू का उत्पादन 2015-16 में 2010-11 का अंदाजन कितना गुणा है ?
The production of potatoes in 2015-16 is approximately how many times that in 2010-11 ?
(A) 1.82
(B) 2.00
(C) 2.10
(D) 1.90
Show Answer
Hide Answer