
प्र. सं. 81 से 85 : तालिका का अध्ययन करें और निम्नलिखित प्रश्नों के उत्तर दें।।
Q. Nos. 81 to 85 : Study the table and answer the following questions.
5 महीनों के दौरान 5 कंपनियों द्वारा बेचे गए उत्पादों की संख्या
Number of products sold by 5 companies during 5 months
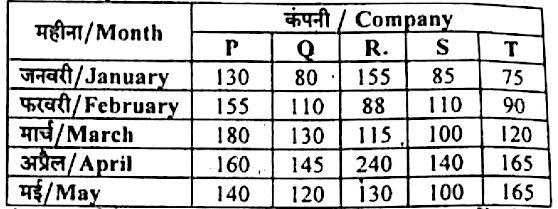
81. मार्च में कंपनी P और R द्वारा बेचे गए उत्पादों की कुल संख्या का अप्रैल में उन्हीं कंपनियों द्वारा बेचे र गए उत्पादों की कुल संख्या से अनुपात कितना है ?
What is the ratio of the total number of products sold by company P and R in March to the total number of products sold by the same company in April ?
(A) 59:80
(B) 12:17
(C) 40:95
(D) 16:19
Show Answer
Hide Answer
82. कंपनी S द्वारा बेचे गए उत्पादों की संख्या में जनवरी से अप्रैल तक लगभग कितने प्रतिशत की वृद्धि हुई ?
The number of products sold by company S approximately increased by what percent from January to April ?
(A) 76.7%
(B) 62.9%
(C) 64.71%
(D) 72.31%
Show Answer
Hide Answer
83. कपनी T द्वारा मार्च, अप्रैल और मई में बेचे गए उत्पादों की कुल संख्या में से, 32% माइल्ड स्टील से बने थे। मार्च अप्रैल और मई में स्टोर T द्वारा बेचे गए माइल्ड स्टील उत्पादों की कुल संख्या कितनी थी ?
Out of the total number of products sold by company T in March, April and May together, 32% were made of mild steel. What was the total number of mild steel products sold by store T in March, April and May together?
(A) इनमें से कोई नहीं/None of these
(B) 144
(C) 150
(D) 155
Show Answer
Hide Answer
84. फरवरी में कंपनी P, S और T द्वारा बेचे गए उत्पादों की औसत संख्या कितनी है ? (अनुमानित)
What is the average number of products sold by company P, S and T in February ? (Approximate)
(A) 120
(B) 112
(C) 116
(D) 118
Show Answer
Hide Answer
85. कंपनी द्वारा जनवरी और मई में मिलाकर बेचे गए उत्पादों की कुल संख्या और समान महीनों में कंपनी R द्वारा बेचे गए उत्पादों की कुल संख्या के बीच का अंतर कितना है ?
(A) 102
(B) 76
(C) 85
(D) 98
Show Answer
Hide Answer
प्र.सं. 86 से 90 : यहाँ दिया गया पाई चार्ट एक विशेष वर्ष के दौरान विभिन्न क्षेत्रों पर विश्वविद्यालय के खर्च को दर्शाता है । चार्ट का ध्यानपूर्वक अध्ययन करें और उसके नीचे दिए गए प्रश्नों के उत्तर दें। (सभी मान डिग्री में दिए गए हैं।)
Q. Nos. 86 to 90 : The pie chart given here shows the spending of university on various sectors during a. particular year. Study. the chart carefully and answer the questions given below it. (All the values are given in degree.)
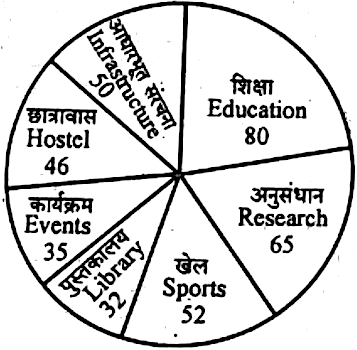
86. कार्यक्रमों की तुलना में अनुसंधान पर लगभग कितना प्रतिशत अधिक खर्च किया गया है ?
Approximately how much percent more is spent on Research than on Events ?
(A) इनमें से कोई नहीं/None of these
(B) 63%
(C) 86%
(D) 90%
Show Answer
Hide Answer
87. छात्रावास पर कुल खर्च का लगभग कितना प्रतिशत खर्च किया जाता है ?
Approximately what percent of total spending is spent on Hostel ?
(A) 12.78%
(B) 9.8%
(C) 11.2%
(D) 11.8%
Show Answer
Hide Answer
88. यदि वर्ष के दौरान विभिन्न क्षेत्रों पर खर्च की गई कुल राशि ₹ 1,80,00,000 हो, तो आधारभूत संरचना पर खर्च की गई राशि छात्रावास पर खर्च की गई राशि से कितनी अधिक है ?
If the total amount spent on various sectors during the year be ₹ 1,80,00,000, then the amount spent on Infrastructure exceeds on Hostel by :
(A) ₹3,00,000
(B) ₹2,00,000
(C) ₹2,50,000
(D) ₹2,80,000
Show Answer
Hide Answer
89. खेलों पर, शिक्षा की तुलना में कितने प्रतिशत कम खर्च किया जाता है ?
How much percent less is spent on Sports than on Education ?
(A) 48%
(B) 32%
(C) 35%
(D) 42%
Show Answer
Hide Answer
90. यदि वर्ष के दौरान खेलों पर खर्च की गई कुल राशि ₹ 1.8 करोड़ थी, तो शिक्षा और अनुसंधान पर कुल खर्च की गई राशि थी:
If the total amount spent on Sports during the year was ₹ 1.8.crores, the amount spent on Education and Research together was:
(A).₹72,50,000
(B) ₹12,50,000
(C) ₹1,45,00,000
(D) ₹7,25,000
Show Answer
Hide Answer
प्र.सं. 91 से 95 : निम्नलिखित लाइन ग्राफ (रेखा आरेख) 2001 से..2006 की अवधि के दौरान दो कंपनियों A और B द्वारा अर्जित प्रतिशत लाभ प्रदान करता है । ग्राफ को ठीक से पढ़ें और प्रश्नो के उत्तर दें।
Q. Nos. 91 to 95 : The following line graph gives the percentage profit earned by two companies A and B during the period 2001 to 2006. Read the graph properly and answer the questions.
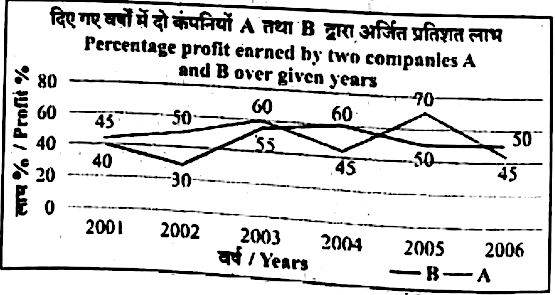
91. 2005 में दो कंपनियों A और B की आय क्रमशः 3:4 के अनुपात में थी । 2005 में उनके व्यय का क्रमशः अनुपात क्या था ?
The income of two companies A and B in 2005 were in the ratio of 3 : 4 respectively. What was the respective ratio of their expenditures in 2005?
(A) 26:34
(B) 17:22
(C) 45:68
(D) 8:11
Show Answer
Hide Answer
92. यदि 2005 में दो कंपनियों की आय समान थी 5005 में कंपनी A के व्यय का कंपनी B के व्यय से अनुपात क्या था ?
If the incomes of two companies were qual in 2005, then what was the ratio of expenditure of company A to that of company B in 2005 ?
(A) 15:17
(B) 5:7
(C) 7:5
(D) 12:17
Show Answer
Hide Answer
93. यदि 2002 में कंपनी B का व्यय ₹ 200 करोड़ था, तो 2002 में आय क्या थी?
(A) ₹283 करोड़
(B) ₹216 करोड़
(C) ₹250 करोड़
(D) ₹260 करोड़
If the expenditure of company B in 2002 was ₹200 crores, what was the income in 2002?
(A) ₹283 crores
(B) ₹216 crores
(C) ₹250 crores
(D) ₹260 crores
Show Answer
Hide Answer
94. यदि 2001 में कंपनी A और B का व्यय समान था और 2001 में दोनों कंपनियों की कुल आय ₹ 342 करोड़ थी, तो 2001 में दोनों कंपनियों का कुल लाभ कितना था ? (लाभ = आय – व्यय)
(A) इनमें से कोई नहीं
(B) ₹ 174 करोड़
(C) ₹ 120 करोड़
(D) ₹102 करोड़
If the expenditures of company A and B in 2001 were equal and the total income of the two companies in 2001 was ₹342 crores, what was the total profit of the two companies together in 2001 ? (Profit = Income – Expenditure)’
(A) None of these
(B) 174 crores
(C) ₹120 crores
(D) ₹102 crores
Show Answer
Hide Answer
95. वर्ष 2003 में कंपनी A का व्यय ₹200 करोड़ था और 2003 में कंपनी की आय 2006 में उसके खर्च के समान थी। 2006 में कंपनी A की आय क्या थी ?
(A) ₹247 करोड़
(B) ₹464 करोड़
(C) ₹376 करोड़
(D) ₹280 करोड़
The expenditure of company A in the year 2003 was ₹200crores and the income of company A in 2003 was the same as its expenditure in 2006. The income of company A in 2006 was :
(A) ₹247 crores
(B) ₹464 crores
(C) ₹376 crores
(D) ₹280 crores
Show Answer
Hide Answer
96. “जज़िया” फिर से लगाने वाले मुगल शासक का नाम लिखिए।
(A) इनमें से कोई नहीं
(B) औरंगजेब
(C) जहाँगीर
(D) हुमायूँ
Write the name of Mughal ruler who reimposed “Jaziya”.
(A) None of these
(B) Aurangzeb
(C) Jahangir
(D) Humayun
Show Answer
Hide Answer
97. निम्नलिखित में से किसे अंग्रेजों द्वारा शुरू किए गए सबसे महत्त्वपूर्ण योगदानों में से एक माना जाता है ?
(A) शिपिंग
(B) रेलवे
(C) वृक्षारोपण और खान
(D) बैंकिंग और बीमा
Which of the following is considered as one of the most important contribution that was introduced by British ?
(A) Shipping
(B) Railways
(C) Plantations and mines
(D) Banking and insurance
Show Answer
Hide Answer
98. “पंचतंत्र की कथाएँ किसके द्वारा लिखी गई थीं ?
(A) तुलसीदास
(B) वाल्मीकि
(C) वेद व्यास
(D) विष्णु शर्मा
The tales of “The Panchatantra” was written by :
(B) Valmiki
(A) Tulsa
(C) Ved Vyasa
(D) Vishnu Sharma
Show Answer
Hide Answer
99. गौतम बुद्ध ने सारनाथ में अपना पहला उपदेश ___ में दिया था।
(A) भूमिस्पर्श मुद्रा
(B) धम्म-चक्र-प्रवर्तन मुद्रा
(C) अभय मुद्रा
(D) ध्यान मुद्रा
In ____, Gautam Buddha delivered his first sermon at Sarnath.
(A. Bhumisparsha Mudra
(B) Dhamma-chakra-pravartana Mudra
(C) Abhaya Mudra
(D) Dhyana Mudra
Show Answer
Hide Answer
100. निम्नलिखित में से किस शासक के दरबारी कवि हरिषेण थे?
(A) इनमें से कोई नहीं
(B) समुद्रगुप्त
(C) स्कंदगुप्त
(D) कुमारगुप्त
Which of the following ruler’s court poet was Harishena?
(A) None of these
(B) Samudragupta
(C) Skandagupta
(D) Kumaragupta
Show Answer
Hide Answer
